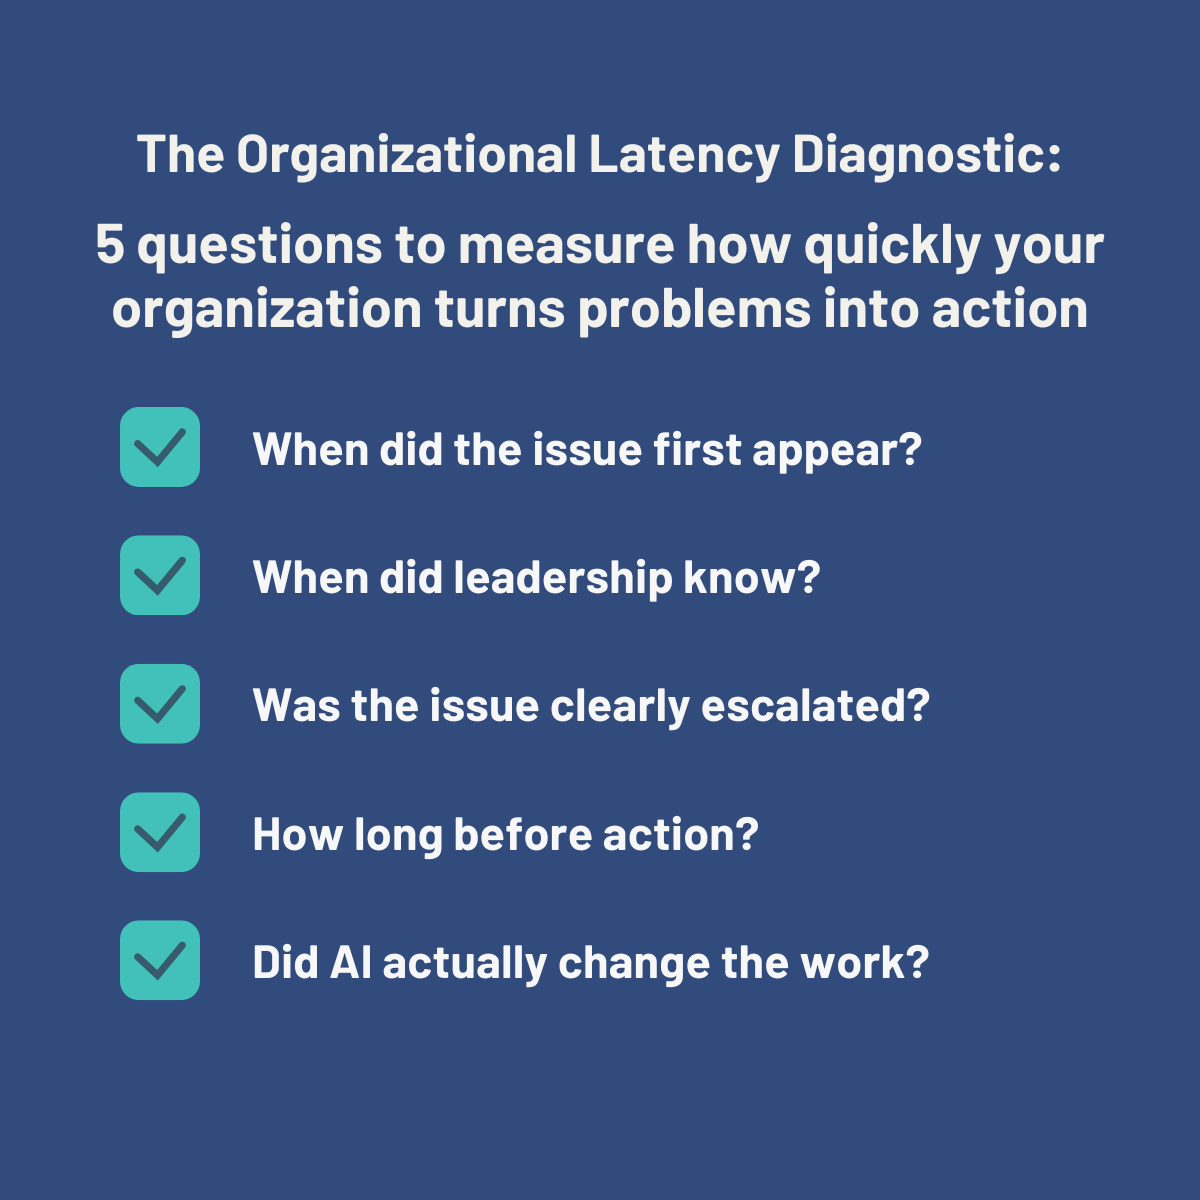
Five Questions to Measure How Quickly Your Organization Turns Problems Into Action
Use this diagnostic to estimate your organization’s current Organizational Latency score and identify where delays occur between operational problems and leadership action.
Most executive teams know they are learning about important problems later than they would like.
The harder question is: how much later?
A customer issue starts repeating.
A product handoff begins breaking down.
A regional team stops trusting the operating model.
An AI tool is being used, but work is not actually changing.
A key initiative has already failed politically, even though it has not failed officially.
In most organizations, these problems begin long before they reach a dashboard, KPI review, board update, or executive meeting.
Leadership usually sees the issue when it surfaces.
The organization experienced it when it started.
The time between those two moments is what we call Organizational Latency.
Organizational Latency is the delay between something important happening in the business and leadership having enough information and context to act.
That delay matters because the longer it lasts, the more expensive the problem becomes. Small execution issues become missed targets. Local customer problems become broader churn risks. AI adoption looks successful in usage reports while actual work remains unchanged.
This is not a failure of leadership attention. It is a visibility problem inside the operating system of the business.
Building on Don Scheibenreif’s autonomous business framing and Rita McGrath’s work on strategic inflection points, this gap is becoming one of the defining management problems of the next decade.
As companies move toward AI-enabled operating models, the issue is no longer just whether leadership can move quickly.
It is whether the organization can identify problems, understand what they mean, and respond while there is still time to change the outcome.
Where Organizational Latency Shows Up
The delay is rarely caused by a single bottleneck.
Instead, it accumulates at multiple points as information moves through the organization and is translated into action.
Detection latency: how long it takes for anyone inside the company to notice the issue, opportunity, or emerging condition.
Reporting latency: how long it takes for that reality to enter a formal channel.
Filtering latency: how much time it spends being summarized, softened, or adjusted as it travels upward.
Decision latency: how long it waits once leadership has it.
Interpretation latency: how long it takes to translate what is happening into a decision about what action to take, especially when the information comes from AI systems, automation workflows, or places where people and AI systems are working together.
The first four have been with us for decades.
The fifth is becoming more important now.
AI creates more reports, recommendations, alerts, workflow data, and performance metrics.
But those outputs do not automatically explain what is happening inside the business.
Leaders may see rising AI usage, faster task completion, or higher volumes of generated work without knowing whether customer outcomes are improving, decisions are getting better, or teams are actually becoming more productive.
That is why interpretation latency matters.
The problem is no longer just getting more information to the top.
It is helping leadership determine what requires action, what can be ignored, and what is actually changing inside the business before the opportunity or problem has already passed.
The Five-Question Diagnostic
The Organizational Latency Diagnostic is designed to help leadership teams measure a delay they may already feel but rarely quantify.
Most executives know that some problems reach them later than they should. What is harder to see is where the delay occurs and how much time is lost along the way.
Did the issue take too long to be noticed?
Was it slow to escalate?
Did it lose clarity as it moved upward?
Did leadership have the information but wait too long to act?
Or, increasingly, did the organization have more data from AI systems without a clear understanding of what that data meant?
The value of this diagnostic is not only the final score.
It is the conversation the score creates.
When leaders answer the questions independently and compare results, the differences can reveal how clearly the organization understands its own information flow, decision speed, and AI adoption reality.
Think of this as a baseline assessment.
Before an organization can reduce Organizational Latency, it needs a reasonable estimate of its current state.
Answer the five questions below. Each question is worth up to 20 points, for a total possible score of 100.
Higher scores suggest that problems are generally reaching leadership and turning into action quickly. Lower scores suggest that issues may be spending too much time inside the organization before leadership can respond.
1. The Last Major Issue
Think of one significant operational problem your leadership team learned about in the last six months.
Estimate the number of days between when the issue first became known somewhere inside the company and when the executive team took action to address it.
Example: A customer escalation pattern was first noticed on March 1. The executive team approved corrective action on March 21. Your answer is 20 days, for a score of 10 points.
Scoring:
Under 5 days = 20 points
5–15 days = 15 points
16–45 days = 10 points
46–90 days = 5 points
More than 90 days = 0 points
2. Decision Re-litigation
Think about the last ten major decisions, policy changes, or initiatives that affected the business.
How many had to be reopened, revised, delayed, clarified, or reworked because important information surfaced late, stakeholders were not aligned, or the original approach did not hold?
Example: Out of the last ten major decisions, three were reopened or substantially revised within 90 days. Your answer is 3, for a score of 15 points.
Scoring:
0–1 decisions reopened = 20 points
2–3 decisions reopened = 15 points
4–5 decisions reopened = 10 points
6–7 decisions reopened = 5 points
8–10 decisions reopened = 0 points
3. Status-Report Reality Check
Think about the significant risks, delays, failures, or escalations your organization experienced last month.
How many were identified in a status report before they became visible problems?
Example: Your organization experienced 10 significant issues last month. Three were flagged in a status report before they became larger problems. Your answer is 30%, for a score of 5 points.
Scoring:
80–100% = 20 points
60–79% = 15 points
40–59% = 10 points
20–39% = 5 points
Under 20% = 0 points
4. Frontline-to-C-Suite Travel Time
Choose a recent problem, risk, or important observation from your largest region, business unit, or operating group that eventually reached senior leadership.
Estimate when it was first raised and when it first appeared in a C-suite discussion, meeting agenda, or executive review.
Example: A regional operations manager raised a recurring customer issue on April 1. It first appeared on the executive agenda on April 29. Your answer is 28 days, for a score of 10 points.
Scoring:
Under 7 days = 20 points
7–14 days = 15 points
15–30 days = 10 points
31–60 days = 5 points
More than 60 days = 0 points
5. AI Deployment Reality
Of the AI initiatives, pilots, or deployments launched in the last two quarters, how many have led to a meaningful and measurable improvement in how work gets done?
Examples may include reduced manual effort, faster processes, better decisions, higher throughput, improved accuracy, or a changed core workflow.
To answer, estimate the total number of AI initiatives launched in the last two quarters. Then estimate how many produced at least one measurable operational improvement.
Example: You launched 12 AI initiatives. Three produced measurable workflow or performance improvements. Your answer is 25%, for a score of 5 points.
Scoring:
80–100% = 20 points
60–79% = 15 points
40–59% = 10 points
20–39% = 5 points
Under 20% = 0 points
How to Interpret Your Score
Add the five scores together for a total out of 100.
This is a working rubric. The ranges will sharpen as more organizations use the diagnostic and contribute to the baseline.
Best-in-Class: 90–100 points
Issues are usually identified, escalated, understood, and acted on in under 5 days.
These organizations are difficult to surprise. They have strong visibility, fast escalation, and enough decision discipline to respond before issues become structural problems.
Healthy: 70–89 points
Issues generally move from awareness to action within 5 to 15 days.
These organizations still experience delays, but they usually catch execution drift, customer issues, and operating friction while there is still time to respond.
Average Enterprise: 40–69 points
Issues often take 15 to 45 days to move from early awareness to executive action.
This is where many large organizations operate. Problems are eventually visible, but often after they have already affected execution, trust, performance, or customer outcomes.
The issue is not executive blindness. It is organizational delay.
At Risk: 20–39 points
Issues often take 45 to 90 days to reach action.
These organizations may discover problems after teams have already adapted around them. Leaders may believe the operating model is working while employees are quietly routing around it.
Under AI-enabled and autonomous business conditions, this becomes strategic risk.
Critical: 0–19 points
Issues often take more than 90 days to reach action.
The organization is governing on stale information. Problems are explained after the fact rather than addressed while they are still manageable.
In this range, dashboards may look calm while the company is already drifting.
Why This Matters Now
Organizational Latency was expensive before AI.
It becomes more consequential as companies move toward autonomous business.
AI systems are entering workflows that leadership often could not fully see even when the work was entirely human. Executives are now trying to measure AI adoption, AI ROI, and human-machine productivity inside organizations that may not have had a reliable baseline for coordination, friction, or decision velocity in the first place.
If you do not have a clear view of how work, decisions, and information currently move through your organization, it is difficult to know whether AI is improving performance or simply adding more activity.
That is the management gap this diagnostic is meant to surface.
Not as a survey.
Not as another dashboard.
As a starting measure of how long it takes the organization to turn problems into action.
How to Use and Share Your Score
Run the diagnostic individually with your executive team first.
Have each leader answer the five questions independently before discussing results as a group.
Then compare answers.
Look especially for the questions where people disagree.
Those disagreements may be as valuable as the score itself.
If the CEO believes an issue reaches the C-suite in two weeks and the COO believes it takes two months, that is not a math problem. It is an operating visibility problem.
If AI adoption looks strong by license utilization but weak by workflow change, that is not a tooling problem. It is an interpretation problem.
If status reports rarely flag risks before they become visible problems, that is not a reporting-format problem. It is a filtering problem.
Once you have compared responses, estimate a team score or score range based on the collective discussion.
The goal is not statistical precision.
The goal is to understand how the leadership team perceives the organization’s latency and where those perceptions diverge.
The point of the Organizational Latency Diagnostic is not to produce a perfect number on the first attempt.
The point is to name a delay most organizations already feel but rarely measure.
If you are willing, reply in the comments with your final score or score range and any observations that emerged from the discussion.
We are compiling an anonymized baseline from the first respondent cohort and will publish what we learn in a follow-up post.